Following our assessment task yesterday it is clear that some students need to revise certain areas of the work we have done in term 1 and 2:
Probability – Relative frequency with ten questions to complete.
Percentages – How to convert fractions and percentages to a pie chart (360 degrees) with ten questions to complete.
Percentage increases and decreases – Worked examples and five problems to solve.
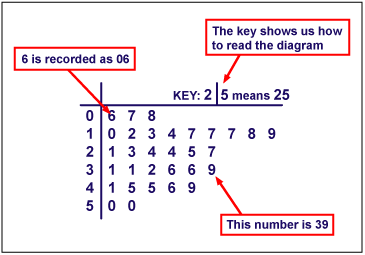
Stem and Leaf plots – Worked example and thirteen questions to solve.
Problem #1: You have a list of 7 numbers. The average of the numbers is 9. If you take away one of the numbers, the average of the numbers is 8. What number did you take away?
Problem #2: Martin has completed five Maths tests and received an average score of 80%. What is the highest average he could have after the next test?
Problem #3: A Year 7 class was asked “How many goals did you shoot at lunchtime?”. The lowest answer was 5 and the highest answer was 20. The total of all the answers was 60. What is the smallest number of students who could have been asked?
