Learning Intention: Students will understand what data is suitable for graphing on a scatter plot and be able to describe the significance of a “line of best fit”.
Success Criteria: You will draw a correctly labelled scatter plot from our arm span and height data and determine if there is a relationship between these measurements.
Last week you learnt the definitions for mean, median, mode and range and created a stem-and-leaf plot using the height of students in Year 7. You also measured the length of seven leaves and calculated the mean, median, mode and range of this data. This week we will investigate another type of graph, the scatter plot. Use the data we collected from our Year 7 Maths Survey to graph arm span against height (in centimeters).
This week we may also get the chance to do other activities with scatter plots:
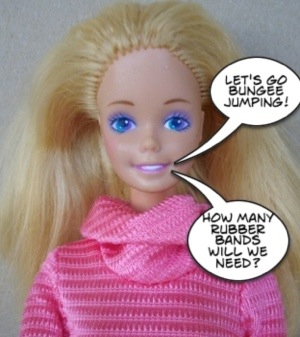
1. Barbie Bungee
How many rubber bands are needed for Barbie to safely jump from a height of 400 cm?
What is the minimum height from which Barbie should jump if 25 rubber bands are used?
How do you think the type and width of the rubber band might affect the results?
Do you think age of the rubber bands would affect the results–that is, what would happen if you used older rubber bands?
If some weight were added to Barbie, would you need to use more or fewer rubber bands to achieve the same results?
State a possible relationship between the amount of weight added and the change in the number of rubber bands needed.
(thanks to Mrs Jirkovsky at North Adams Public School for writing about this activity on her blog!)
2. Be an actuary – distance vs earthquake intensity.


